
Predictive Customer Churn: The Case of Energy Retail
- Wiimer

- Aug 28, 2020
- 2 min read
Customer retention is one of the boldest challenges for energy retailers. The sector deregulation and increasingly high competition in the retail side, sparked the development of customer analytics.
In view of this market driver, Wiimer has built an highly accurate machine learning model, based on energy retail BigData. Our data scientists have managed to select and normalize meaningful variables to boast the model accuracy.

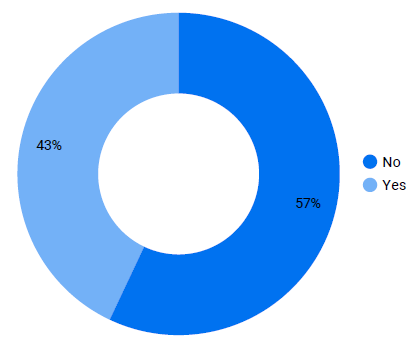

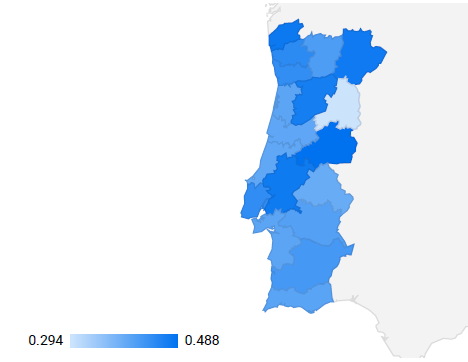
Fig. 1: Illustrative Customer Churn Rate (left) and Churn Rate per Region (right)
The variables set should describe the customer "personas", including demographic attributes (age, education, income, family), commercial variables (retailer replacement, complaints, multi-utility supply, payment mode, debts, contract duration, house ownership) and technical features (demand, peak load, tariff scheme).


Fig. 2: Churn Rate per Age (left) and the effect of the number of retailer replacements on customer churn (right)
Amidst the development of the learning algorithm, one identified the most determining variables for the current illustrative retailer. Besides the complaints level (traditionally critical), the mode of payment is one of the most decisive factors in what pertains to client churn. Indeed, customers with direct debit tend to be rather loyal to the retailer. Still the frequency of retailer replacement becomes a good learner with the increase of supplier changes.


Fig. 3: Churn Rate per complaint level (left) and Churn Rate per payment mode (right)
Finally, the dataset was computed with different learning algorithms. Boosting ensemble models turned to lead to the highest performance metrics, especially AdaBoost which reached more than 90% of accuracy.


Fig. 4: Algorithm confusion matrix (left) and ROC curce (right)
Wiimer's decision-aid approach goes beyond the traditional predictive churn models. Besides analyzing endogenous historical data (from the retailer's customers), one has developed a "game theory" methodology to integrate the competitors attributes in the market. Following this method, each churn classification is subject to an additional score based on the combination of the "Best-in-class" per attribute. The retailers "Best-in-class" rate is provided by the Net Promoter Score (NPS), that should be periodically measured.

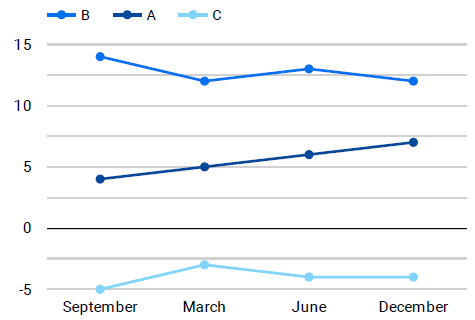


Fig. 5: NPS for Service Quality (left) and Price (right) of the retailers A, B and C
The risk model is finally built by combining the predictive Churn Index (blending the learning algorithm with game theory) with the customer Criticality. In this case, Criticality was assumed to be a purely financial index, i.e. the annual revenues generated from each customer.
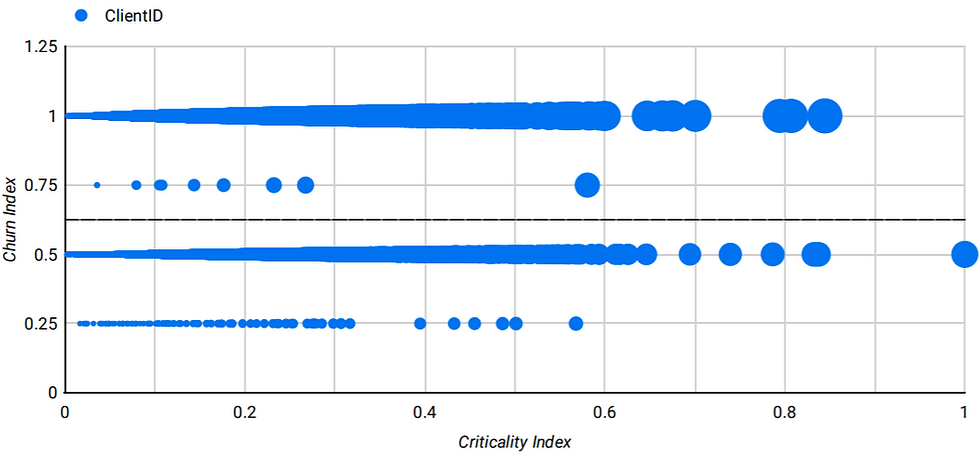
Fig. 6: Risk model for Energy Customer Churn


Comments